Bacteria
Bacteria are microscopic living organisms that can grow and multiply quickly when the conditions are right. When bacteria are placed in a fresh environment with nutrients, they follow a predictable pattern of growth called the bacterial growth curve.
Summary of Bacterial Growth
- Bacterial growth refers to the increase in the number of bacterial cells through a process called binary fission.
- It occurs in four main phases: lag phase, log (exponential) phase, stationary phase, and death phase, each showing different growth patterns.
- Factors like temperature, nutrients, pH, oxygen, and moisture greatly affect the rate and pattern of bacterial growth.
Table of Contents
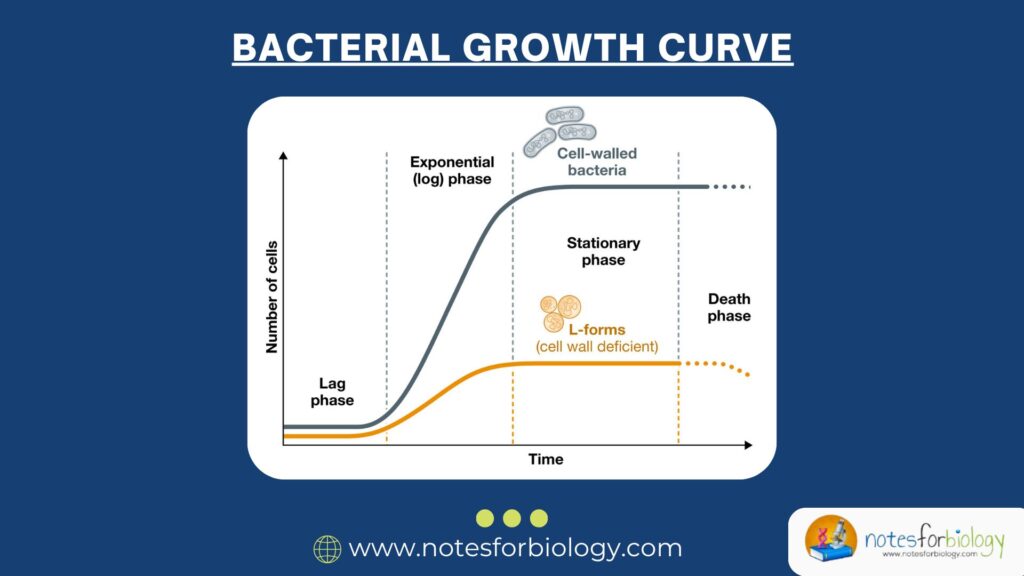
Bacterial Growth Curve
This curve has four main phases: lag phase, log (or exponential) phase, stationary phase, and death (or decline) phase. Each phase represents a different stage in the life cycle of bacteria and is influenced by factors like nutrients, temperature, pH, and oxygen levels.
1. Lag Phase
The lag phase is the first stage of bacterial growth. In this phase, bacteria are alive and active but not dividing yet. This happens because the bacteria are adjusting to the new environment. They are preparing to grow by producing enzymes, absorbing nutrients, and repairing any damage from their previous environment.
Even though the number of bacteria does not increase during the lag phase, important internal changes are taking place. The length of this phase depends on the type of bacteria and how different the new environment is compared to the old one. For example, if bacteria are transferred from a cold to a warm environment with fresh nutrients, they may need more time to adjust.
2. Log Phase (Exponential Phase)
After the lag phase, bacteria enter the log phase, also called the exponential phase. This is the stage where they grow and divide very quickly. During this phase, the number of bacteria doubles at a constant rate, which can be as fast as every 20 minutes under ideal conditions.
This phase is called the exponential phase because the growth follows an exponential pattern: 1 becomes 2, then 4, then 8, 16, and so on. The bacteria are healthy and have plenty of nutrients and space to grow. This phase is important in labs when scientists want to study active bacterial cells or produce large amounts of a bacterial product.
The log phase is also the stage where bacteria are most sensitive to antibiotics and disinfectants because they are actively dividing and using energy.
3. Stationary Phase
Eventually, the nutrients in the environment start to run out, and waste products build up. This causes the growth rate to slow down, and the number of new bacteria being produced equals the number of bacteria dying. This balance is known as the stationary phase.
In the stationary phase, the total number of bacteria remains the same, but the cells may not be as healthy as before. They may shrink, change shape, or form protective structures like endospores to survive harsh conditions.
Some bacteria also start to produce useful compounds like antibiotics during this phase, as a defense against other microbes. This phase can last a long time depending on how stable the environment is.
4. Death Phase (Decline Phase)
If the conditions continue to get worse , for example, if nutrients are completely used up and waste becomes toxic—the bacteria enter the death phase. In this stage, more cells die than are being produced.
The bacterial population starts to decline, and the cells may lose their ability to function or reproduce. This phase continues until most of the bacteria die, although some may survive in a dormant state.
Some bacteria can resist this phase better than others by forming endospores or going into a resting state. However, in most cases, the culture eventually collapses if not transferred to a fresh environment.
Graph of the Bacterial Growth Curve
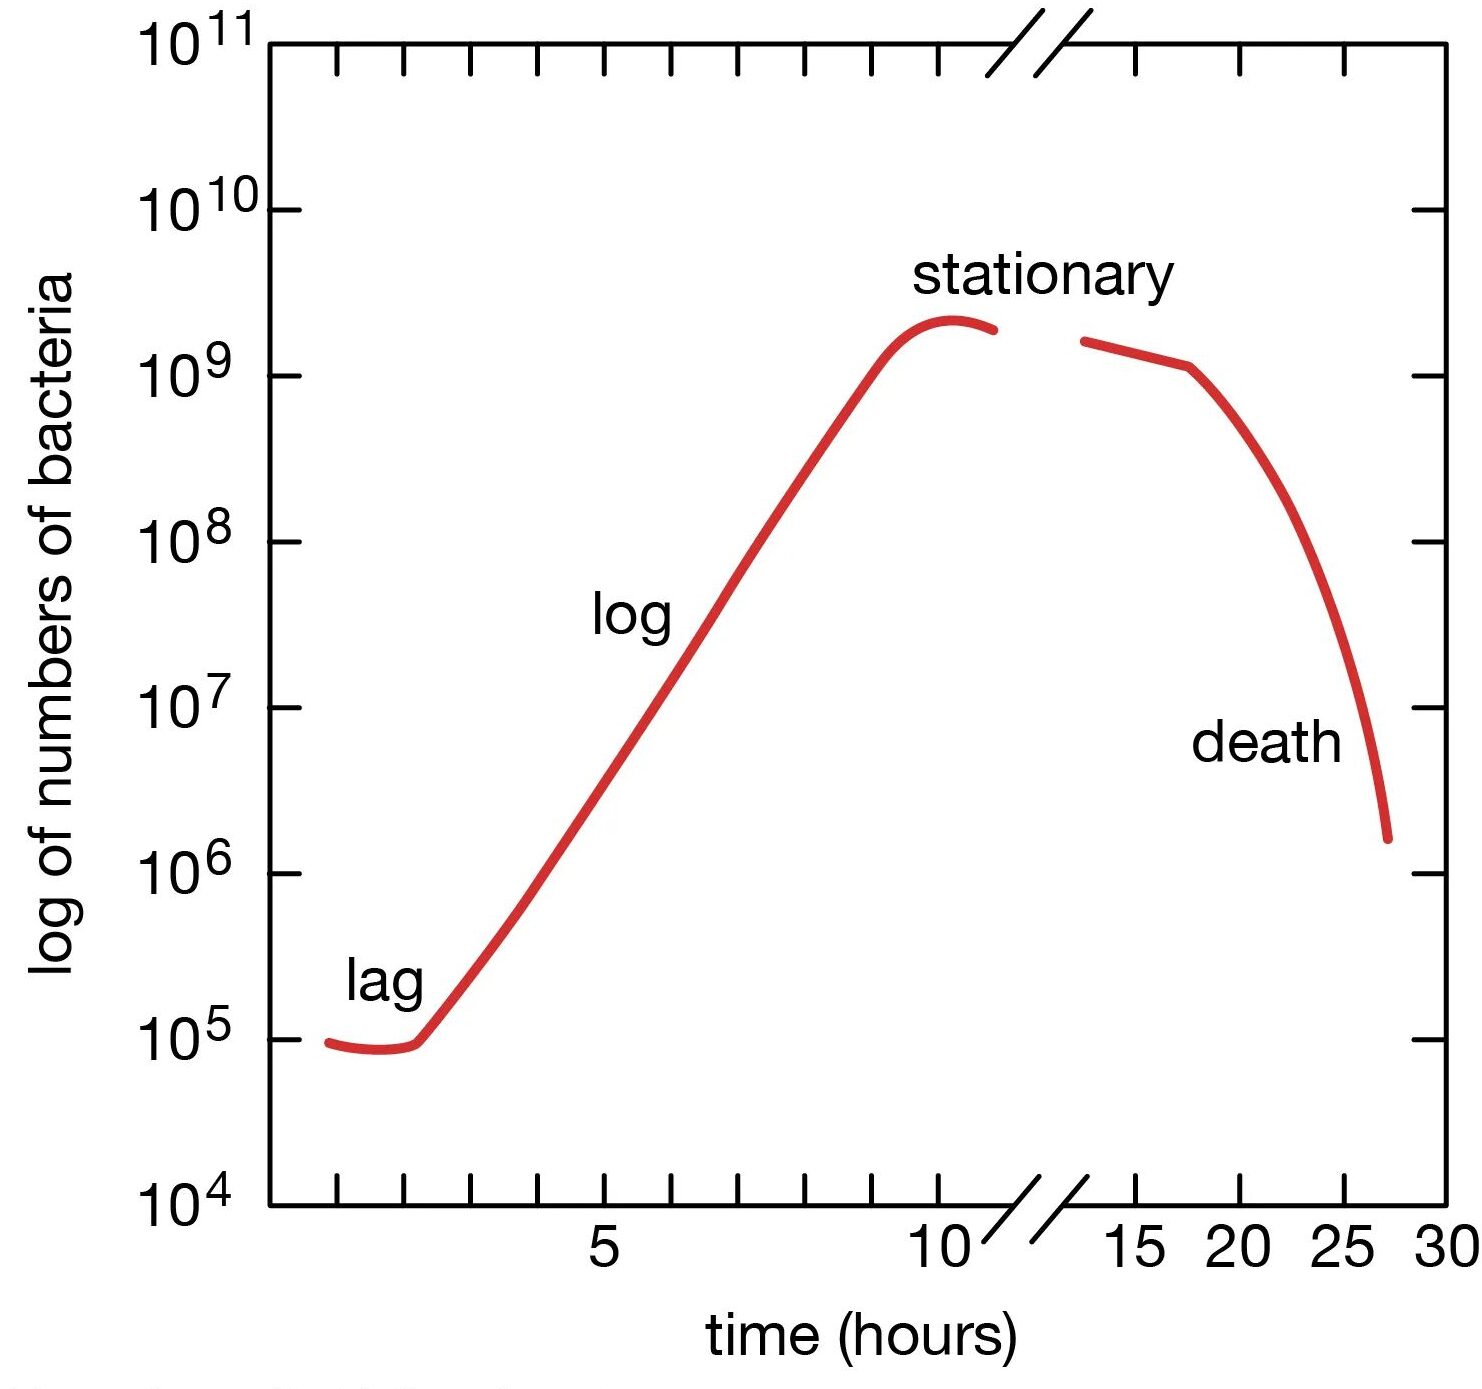
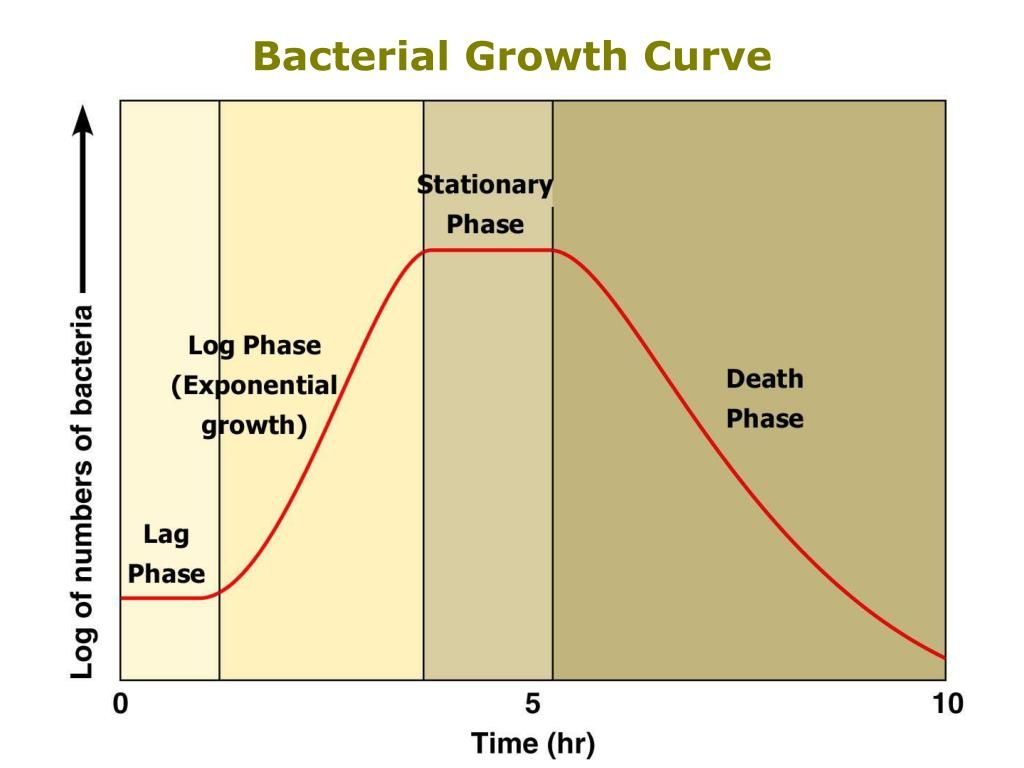
When the bacterial growth curve is drawn on a graph, the x-axis (horizontal line) shows time, and the y-axis (vertical line) shows the number of bacterial cells (usually in logarithmic scale). The curve looks like an S-shape and includes the four phases:
- Lag Phase – flat at the beginning (no increase in numbers)
- Log Phase – steep upward slope (rapid growth)
- Stationary Phase – flat again (growth levels off)
- Death Phase – downward slope (decline in population)
This graph helps scientists understand how bacteria behave in different environments and is useful in fields like medicine, food safety, and fermentation.
Importance of the Bacterial Growth Curve
Understanding the bacterial growth curve has many practical uses:
- In medicine, it helps doctors know when bacteria are most sensitive to antibiotics.
- In food industry, it helps in preventing food spoilage and designing preservation techniques.
- In microbiology labs, it helps researchers know when to harvest bacterial cultures.
- In biotechnology, it helps in maximizing production of useful products like enzymes and vitamins.
Factors Influencing the Growth Curve
Several factors can affect the shape and length of each phase in the bacterial growth curve:
- Temperature: Too high or too low temperatures can slow down growth or kill bacteria.
- pH levels: Extreme pH levels can damage bacterial enzymes and stop growth.
- Oxygen: Some bacteria need oxygen to grow (aerobic), while others grow without it (anaerobic).
- Nutrients: A rich supply of food helps in faster growth; lack of nutrients leads to early stationary and death phases.
- Waste accumulation: Build-up of toxic waste can stop growth and speed up cell death.
- Space: Limited space in a closed environment, like a test tube or petri dish, can slow growth.
Examples from Real Life
- Food Spoilage: When food is left out, bacteria go through these growth phases. First, there is a short lag phase as they adjust, then a log phase with fast growth. Eventually, spoilage becomes visible, and the stationary phase begins.
- Infections: When bacteria enter the human body, they may start growing slowly (lag phase), then multiply quickly (log phase), causing symptoms. If the body’s immune system or antibiotics work, the bacteria will die (death phase).
- Yogurt Production: Useful bacteria like Lactobacillus go through the growth curve during fermentation. They grow rapidly, produce acids, and then stop growing as the environment becomes too acidic.
How Scientists Use the Growth Curve
Scientists use special tools to measure bacterial growth over time. They might measure:
- Turbidity (cloudiness): Using a spectrophotometer, they measure how cloudy a liquid culture becomes as bacteria grow.
- Colony count: They take samples at different times and count the number of colonies on a petri dish.
- Dry weight: Measuring the weight of dried bacteria to estimate growth.
These methods help track the growth curve and study how different conditions affect bacterial life.
Conclusion
The bacterial growth curve shows how bacteria grow over time in a closed environment. It includes four main phases: lag, log, stationary, and death. Each phase reflects changes in the bacterial population and is influenced by many factors like nutrients, temperature, and oxygen.
Understanding this curve is important in many areas, such as treating infections, preserving food, and conducting scientific research. With the help of this knowledge, people can control bacterial growth in helpful or harmful situations.
FREQUENTLY ASKED QUESTION
What are the different phases of bacterial growth?
The different phases of bacterial growth are lag phase, log (exponential) phase, stationary phase, and death (decline) phase, each representing a stage in the life cycle from adjustment to rapid growth, balance, and eventual decline.
What happens in lag phase?
In the lag phase, bacteria do not multiply but stay active as they adjust to the new environment by preparing their cells, producing enzymes, and absorbing nutrients needed for growth.
What happens in log phase?
In the log phase, bacteria grow and divide rapidly at a constant rate, doubling in number as they have plenty of nutrients and ideal conditions for multiplication.
Related Articles