Modern evolutionary biology relies heavily on tools that help visualize relationships between organisms, both living and extinct. One of the most widely used methods for this purpose is cladistics, and its graphical representation the cladogram.
Understanding cladograms is essential for students and researchers because these diagrams provide a clear, testable hypothesis of how species or groups may have diverged from common ancestors. They also help in organizing biodiversity and studying evolutionary trends.
Table of Contents
Importance of Cladistics in Modern Evolutionary Biology
Cladistics has revolutionized the way biologists classify organisms by focusing solely on shared derived characteristics to infer evolutionary relationships. This method minimizes subjective judgment and bases relationships on quantifiable data.
By doing so, cladistics provides more objective, testable, and reproducible classifications of life, which are crucial for research in systematics, paleontology, molecular biology, and ecology.
Why Understanding Cladograms is Essential for Students and Researchers
It visually depict evolutionary hypotheses and help trace the lineage of organisms. They serve as educational tools, providing insight into the concepts of descent with modification and speciation.
For researchers, interpreting cladograms allows for comparison of genetic and morphological data, guides fossil identification, and assists in understanding patterns of character evolution.
What is a Cladogram?
It is a branching diagram that represents evolutionary relationships among a set of organisms or taxa. Unlike family trees that show actual ancestry, cladograms reflect hypotheses based on shared derived traits.
These diagrams are fundamental in systematics and evolutionary biology because they present a clear visual summary of how species or groups might be related through common ancestry.
Definition of Cladogram
It is a diagram that depicts the relative evolutionary positions of species or groups based on shared derived characteristics, known as synapomorphies. It is structured like a tree, with branches representing diverging evolutionary lines.
It illustrates relationships rather than time or genetic distance, focusing purely on the order of divergence from a common ancestor.
Historical Development of Cladistic Methods
The concept of cladistics emerged in the mid-20th century, primarily through the work of Willi Hennig, a German entomologist. He proposed using shared derived characteristics for classifying organisms, introducing the terms clade and synapomorphy.
Since then, cladistics has become the primary method of classification in evolutionary biology, evolving with the incorporation of molecular data and computational tools.
Purpose and Uses
It help biologists:
- Visualize hypotheses of evolutionary relationships.
- Organize species based on evolutionary history rather than superficial similarity.
- Identify shared derived traits for groups.
- Make predictions about extinct organisms based on related living species.
They are widely used in fields such as taxonomy, paleontology, molecular biology, and conservation biology.
Key Features
Understanding the structural components of a cladogram is crucial for interpreting evolutionary relationships. These diagrams consist of several elements, each with a specific role in illustrating divergence and relatedness.
Branching Diagram Representation
It is typically drawn as a branching tree-like figure. Each branch point represents a hypothetical common ancestor, with the lines diverging to depict descendant species.
This branching pattern helps to visualize how groups might have diverged through evolutionary events such as speciation.
Hypothesis of Evolutionary Relationships
They are not direct records of ancestry but rather testable hypotheses about relationships based on shared derived characteristics. As new data emerges, these hypotheses may be revised, reflecting the dynamic nature of evolutionary science.
This makes cladograms invaluable in systematics, as they can be updated with both fossil discoveries and molecular data.
Equal Length Branches: What It Indicates
In a typical cladogram, branch lengths are not proportional to time or genetic change. All branches usually appear to have equal length, indicating only the sequence of divergence rather than evolutionary distance or duration.
For such measurements, phylograms or chronograms are used instead.
Parts of a Cladogram Explained
It is composed of several standard parts, each contributing to the clarity and interpretation of evolutionary relationships depicted within the diagram.
Nodes: Intersection Points
Nodes are the points where branches split, representing the hypothetical common ancestors of descendant groups. Each node marks a divergence based on one or more shared derived characteristics.
They serve as critical reference points for determining the evolutionary pathways of various taxa.
Branches: Lines Representing Taxa
Branches are the lines connecting taxa to one another and to their common ancestors. Each branch represents a lineage evolving from a node and may terminate in a modern or extinct species.
The branching structure illustrates both direct and indirect evolutionary relationships.
Clades: Groups of Organisms Sharing a Common Ancestor
A clade is a group of organisms that includes a single common ancestor and all its descendants. Clades are fundamental units in cladistics and are identified by tracing back to the most recent common node.
Clades are typically marked on a cladogram, showcasing the evolutionary unity of certain groups.
Outgroup: Its Role and Importance
An outgroup is a taxon that is related to the groups under study but diverged before their common ancestor. It serves as a reference point, helping to determine which character states are ancestral and which are derived.
Selecting an appropriate outgroup is vital for rooting the cladogram and accurately inferring evolutionary pathways.
How to Read and Interpret
Once a cladogram is constructed, it serves as a hypothesis for how various species or taxa are related. Correct interpretation is essential for deriving meaningful evolutionary conclusions from the diagram.
Interpreting cladograms involves tracing relationships, identifying shared traits, and determining evolutionary history based on branching patterns.
Following Evolutionary Paths
When reading a cladogram, one starts at the root, tracing along the branches toward the terminal taxa. Each branching point or node indicates a divergence event, suggesting that species on different branches evolved from a shared ancestor at that node.
The closer two species are in terms of shared branching points, the more closely related they are considered to be. This method allows biologists to track evolutionary pathways and reconstruct lineage histories.
Identifying Common Ancestors
At each node, one can infer the presence of a hypothetical common ancestor. Organisms connected by the same node are assumed to have descended from this ancestor, sharing inherited derived traits.
By following the nodes and branches, researchers can determine which species share more recent common ancestors and which diverged earlier in evolutionary history.
Understanding Shared Derived Characteristics (Synapomorphies)
A key concept in cladistic analysis is the use of synapomorphies characteristics present in an ancestor and shared by all its descendants. Cladograms are built on these traits to hypothesize relationships.
Recognizing which organisms share derived traits allows researchers to group them into clades and differentiate between closely and distantly related species.
Cladogram vs. Phylogram: What’s the Difference?
While cladograms and phylograms appear visually similar, they serve different purposes and represent different types of evolutionary information. It’s important to distinguish between the two when studying evolutionary relationships.
Definition of Phylogram
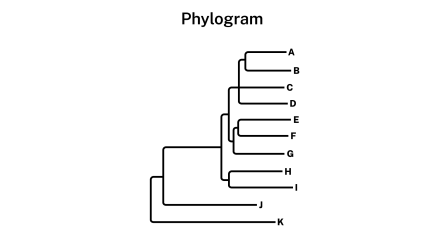
A phylogram is a branching diagram that, like a cladogram, shows evolutionary relationships. However, in a phylogram, the length of each branch reflects the amount of genetic change or time since divergence, offering a measure of evolutionary distance.
Phylograms are particularly useful when comparing molecular sequence data, as they convey both relationships and evolutionary rates.
Key Differences in Branch Length Significance
The primary difference between a cladogram and a phylogram lies in the meaning of branch length:
- In a cladogram, branch lengths are arbitrary and indicate only the sequence of divergence.
- In a phylogram, branch lengths are proportional to the number of evolutionary changes, such as DNA mutations, or to time.
Thus, while both diagrams show relatedness, phylograms provide an additional layer of evolutionary detail.
Which to Use: Cladogram or Phylogram?
The choice between using a cladogram or a phylogram depends on the research objective:
- Use a cladogram for visualizing hypotheses of relationships based on shared derived traits without concern for time or evolutionary rates.
- Use a phylogram when incorporating molecular data, mutation rates, or geological time scales is necessary for understanding the pace and timing of evolutionary events.
Examples of It in Biology
Cladograms are valuable tools across multiple areas of biology, from teaching basic evolutionary concepts to analyzing genomic data. They are especially useful in illustrating well-known evolutionary histories.
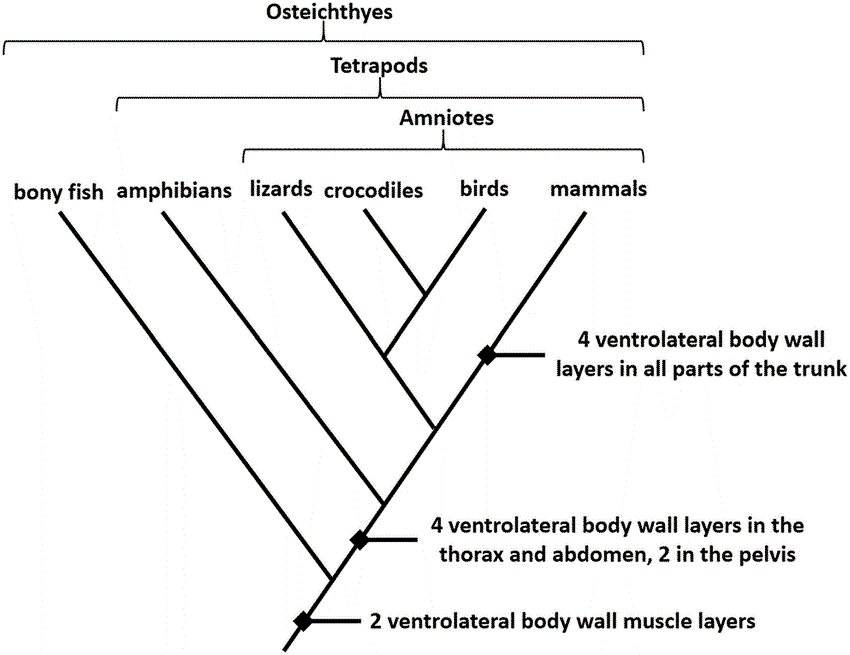
Vertebrate Evolution Example
A classic example of a cladogram shows the evolutionary relationships among vertebrates. It highlights how fishes, amphibians, reptiles, birds, and mammals diverged from common ancestors, with traits like vertebrae, lungs, or amniotic eggs marking key evolutionary steps.
This example helps students visualize the origin of major animal groups and their defining characteristics.
Plant Evolution Cladogram
Cladograms have also been used to depict the evolution of plant groups, tracing the divergence from early green algae to mosses, ferns, gymnosperms, and angiosperms. Derived traits like vascular tissue, seeds, and flowers mark significant evolutionary milestones.
This type of cladogram clarifies relationships within the plant kingdom and the emergence of adaptations to terrestrial environments.
Human Ancestry and Primate Cladogram
A well-known cladogram traces the relationships among humans, chimpanzees, gorillas, and other primates. It identifies shared derived traits such as opposable thumbs and large brains, showing that humans and chimpanzees share a more recent common ancestor than either does with gorillas.
This example is frequently cited in anthropology and genetics courses to illustrate human evolutionary history.
Constructing a Cladogram: Step-by-Step
Building a cladogram involves collecting and organizing data about species’ characteristics, determining which are derived traits, and graphically representing the hypothesized relationships.
The following steps outline the basic procedure used in cladistic analysis.
Gathering Data (Morphological and Molecular)
The first step involves collecting data on various morphological traits (physical characteristics) or molecular sequences (DNA, RNA, or protein data) for the taxa under study. Both data types are valuable, though molecular data is now more widely used for its precision.
Accurate and consistent data collection ensures reliable cladogram construction.
Determining Character States
For each characteristic, biologists identify its different states — such as present or absent, or primitive versus derived. These states are compared across taxa to determine shared derived traits.
This step helps in distinguishing which features evolved more recently and can serve as markers of evolutionary divergence.
Outgroup Selection
An outgroup a taxon related to but outside the group being studied — is chosen to help determine the ancestral character state for each trait. The outgroup provides a baseline for distinguishing between primitive and derived traits in the ingroup taxa.
Proper outgroup selection is critical for correctly rooting the cladogram.
Building a Data Matrix
A data matrix is constructed, listing each taxon and the character states for the selected traits. This matrix is analyzed to identify patterns of shared derived characteristics and establish likely evolutionary groupings.
The matrix serves as the blueprint for constructing the final cladogram.
Drawing the Cladogram
Using the data matrix, a cladogram is drawn by placing taxa at the branch tips, connecting them through nodes based on shared derived traits. The resulting diagram visually represents hypotheses of evolutionary relationships among the taxa.
The cladogram is then interpreted and, if necessary, revised based on new evidence or alternative analytical methods.
Importance of Outgroups in Cladistic Analysis
Outgroups play a pivotal role in cladistic analysis by providing a reference point for determining whether a character state is ancestral or derived. This decision affects how traits are grouped and which taxa are considered more closely related.
How Outgroups Determine Character Polarity
Character polarity refers to whether a trait is ancestral (present in the outgroup) or derived (absent in the outgroup but present in the ingroup). By comparing traits in the outgroup and ingroup, biologists infer the sequence of evolutionary changes.
This analysis ensures the correct direction of character evolution and proper rooting of the cladogram.
Example Applications
Outgroups have been critical in resolving disputes about the placement of taxa in evolutionary trees. For instance, the addition of an appropriate outgroup clarified the position of whales within the mammal clade, revealing their close relationship to even-toed ungulates like hippos.
Such applications highlight the importance of outgroup analysis in producing accurate and meaningful cladograms.
Modern Tools for Cladogram Construction
With the advent of computational tools and bioinformatics, constructing cladograms has become faster, more accurate, and capable of handling large datasets. These tools have expanded the scope of cladistic analysis into molecular systematics and genomics.
Software Applications: PAUP*, Mesquite, TNT
Several software packages are available for performing cladistic analyses:
- PAUP* (Phylogenetic Analysis Using Parsimony) is widely used for tree construction based on parsimony and likelihood methods.
- Mesquite offers a flexible interface for editing and visualizing evolutionary trees.
- TNT (Tree analysis using New Technology) is known for its speed in handling large datasets and extensive tree search options.
These programs assist researchers in creating and evaluating multiple cladograms, improving the reliability of evolutionary hypotheses.
Online Tools and Open-Source Databases
In addition to standalone software, several web-based tools and databases support cladogram construction. Websites like Phylogeny.fr, TreeBASE, and OneZoom provide user-friendly platforms for building, sharing, and exploring evolutionary trees.
Open-source data repositories allow researchers to access curated molecular data, facilitating comparative analyses across studies.
Limitations and Challenges in Cladogram Analysis
Despite its strengths, cladistics faces several challenges and limitations that researchers must address when constructing and interpreting cladograms.
Homoplasy and Convergent Evolution
Homoplasy occurs when similar traits evolve independently in unrelated groups, often due to convergent evolution or evolutionary reversals. This can obscure true relationships and lead to incorrect groupings in a cladogram.
Recognizing and accounting for homoplasy is essential for accurate cladistic analysis.
Incomplete Fossil Records
The fossil record is inherently incomplete, with gaps that make it difficult to trace the full evolutionary history of certain groups. Missing data can affect cladogram accuracy, especially when analyzing extinct taxa.
Combining fossil data with molecular evidence can help bridge these gaps.
Molecular Data Conflicts
Different genes or molecular markers can produce conflicting evolutionary trees. These discrepancies arise from factors like horizontal gene transfer, incomplete lineage sorting, or gene duplication.
Resolving these conflicts requires careful data selection, multiple gene analyses, and advanced computational techniques.
Recent Advances in Cladistic Research
Recent technological innovations have transformed cladistics, enabling larger, more detailed analyses and revealing deeper evolutionary relationships.
Genomic Data Integration
Modern cladistics now integrates whole-genome sequencing data, offering unprecedented resolution in determining evolutionary relationships. Genomic data allows researchers to analyze thousands of traits simultaneously, producing highly detailed cladograms.
This approach has clarified complex phylogenies in plants, animals, and microbes.
Automated Cladogram Generation
Automated algorithms now streamline cladogram construction, reducing manual input and improving reproducibility. These algorithms use methods like maximum likelihood and Bayesian inference to assess evolutionary hypotheses.
Automated systems handle vast molecular datasets and generate multiple, statistically-supported evolutionary trees.
AI and Machine Learning Applications
Artificial intelligence (AI) and machine learning are increasingly applied in systematics, identifying evolutionary patterns and optimizing tree-building algorithms. These technologies accelerate analyses and detect patterns in complex datasets that traditional methods might overlook.
Their integration represents the future of large-scale evolutionary research.
Conclusion
They remain essential tools for understanding the evolutionary history of life on Earth. By organizing organisms based on shared derived traits, cladograms provide a clear, testable hypothesis about relationships among species.
Their applications extend across biology, from systematics and paleontology to conservation and genomics. As computational tools, molecular data, and AI technologies advance, cladistic research will continue to refine our understanding of life’s history and evolutionary mechanisms.
Frequently Asked Questions (FAQ)
What is the main difference between a cladogram and a phylogenetic tree?
A cladogram shows the relative relationships among species based on shared traits, while a phylogenetic tree also represents evolutionary time or genetic distance through branch lengths.
How do biologists choose an outgroup for analysis?
Biologists select an outgroup that is closely related to, but not part of, the group under study, to help determine which traits are ancestral and which are derived.
Can cladograms change with new scientific data?
Yes cladograms are hypotheses of relationships and are revised as new morphological, genetic, or fossil evidence becomes available.