
Introduction
The Chi-square test (often written as χ² test) is one of the most commonly used statistical tests in research. Whether you’re a biologist, psychologist, sociologist, or just someone analyzing survey data, it can help you determine whether there’s a significant association between categorical variables. It’s especially powerful in understanding frequencies and proportions in data, rather than means or averages.
In this comprehensive guide, we will explore the formula, uses, types, Chi-square distribution table, and examples in a clear and human-friendly manner.
Table of Contents
What is the Chi-square Test?
It is a non-parametric statistical test that compares observed frequencies in categories to the expected frequencies derived from a specific hypothesis.

In simpler terms, it helps you answer questions like:
- Is there a relationship between gender and voting preference?
- Are students equally distributed among different courses?
- Is a die fair, or does it favor certain numbers?
When to Use the Chi-square Test?
It is used when:
- You are working with categorical variables (e.g., gender, occupation, marital status)
- Your data are represented in counts or frequencies (not means or percentages)
- You want to test independence or goodness-of-fit
Types of Chi-square Tests
There are two main types of Chi-square tests:
1. Chi-square Test of Independence
- Purpose: To determine whether two categorical variables are related.
- Example: Is there an association between smoking status (smoker/non-smoker) and lung disease (yes/no)?
2. Chi-square Goodness-of-Fit Test
- Purpose: To determine whether the observed distribution matches the expected distribution.
- Example: Are the colors of M&Ms in a pack evenly distributed?
Chi-square Test Formula
The formula for the Chi-square statistic is:
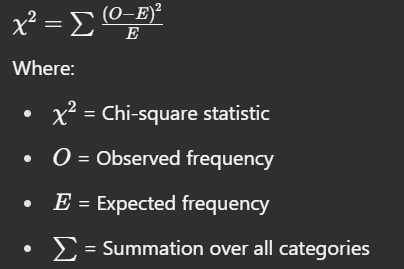
This formula is applied by calculating the difference between the observed and expected frequencies for each category, squaring it, dividing by the expected frequency, and summing it across all categories.
How to Calculate the Chi-square Statistic
Let’s break it down into steps:
- State the hypothesis:
- Null Hypothesis (H₀): There is no difference or association.
- Alternative Hypothesis (H₁): There is a difference or association.
- Create a contingency table:
- Organize your observed data into rows and columns.
- Calculate expected values:
For each cell:
E=(Row Total)×(Column Total) - Apply the Chi-square formula:
Use the values of O and E to calculate χ2\chi^2. - Find the degrees of freedom (df):
df=(r−1)(c−1)df = (r – 1)(c – 1) for contingency tables
df=(k−1)df = (k – 1) for goodness-of-fit
where r = rows, c = columns, k = number of categories - Use the Chi-square table to find the critical value or p-value.
- Interpret the result:
If the calculated χ2\chi^2 is greater than the table value → reject the null hypothesis.
Chi-square Table (Critical Values)
| df (Degrees of Freedom) | 0.05 Level | 0.01 Level |
|---|---|---|
| 1 | 3.84 | 6.63 |
| 2 | 5.99 | 9.21 |
| 3 | 7.81 | 11.34 |
| 4 | 9.49 | 13.28 |
| 5 | 11.07 | 15.09 |
Note: Use this table to compare with your calculated χ2\chi^2 value.
Worked Example: Chi-square Test of Independence
Scenario:
A researcher wants to test if gender is related to voting preference.
| Party A | Party B | Total | |
|---|---|---|---|
| Male | 30 | 20 | 50 |
| Female | 10 | 40 | 50 |
| Total | 40 | 60 | 100 |
Step 1: Calculate Expected Values
For Male – Party A:
E=(50×40)/100 = 20
For Male – Party B:
E=(50×60)/100 = 30
Repeat for Female:
- Party A: 20
- Party B: 30
Step 2: Calculate χ2\chi^2

Step 3: Degrees of Freedom
df=(2−1)(2−1)=1
Step 4: Compare with Table
Critical value at df = 1 and 0.05 level = 3.84
Since 16.66 > 3.84 → Reject the null hypothesis.
Conclusion:
There is a significant association between gender and voting preference.
Common Uses of the Chi-square Test
- Medical Research:
- Comparing treatment outcomes across groups
- Disease prevalence by demographic categories
- Market Research:
- Consumer preferences by age or gender
- Product satisfaction among regions
- Social Science:
- Studying relationships between education level and occupation
- Family structure and academic performance
- Genetics:
- Checking if observed genetic traits match Mendelian ratios
- Education:
- Association between teaching method and student pass rate
Assumptions of the Chi-square Test
- Data must be in the form of counts/frequencies
- Categories should be mutually exclusive
- Observations are independent
- Expected frequency in each cell should be ≥ 5 (for validity)
Limitations of the Chi-square Test
- Cannot be used for continuous data (like height or weight)
- Doesn’t tell the strength or direction of the association
- Sensitive to small sample sizes
- Large samples can make small differences appear statistically significant
Tips for Using the it
- Ensure your data is appropriately categorized
- Check expected frequencies before using the test
- Use statistical software (like SPSS, R, Excel) to ease the calculation
- Interpret the results along with the context and effect size
Chi-square Test in Software Tools
Most data analysis tools can perform it easily:
- Excel: Use the CHISQ.TEST function
- SPSS: Crosstabs → Statistics → Chi-square
- R: chisq.test() function
- Python: scipy.stats.chi2_contingency()
Summary
| Feature | Description |
|---|---|
| Type of Test | Non-parametric |
| Data Type | Categorical |
| Formula | χ2=∑(O−E)2/E |
| Uses | Independence, Goodness-of-fit |
| Key Output | Chi-square statistic, p-value |
| Interpretation | Compare with critical value or p-value threshold |
Conclusion
It is a simple yet powerful tool for analyzing relationships between categorical variables. Whether you’re testing if observed data fit expected ratios or exploring associations between two categories, the it gives you a statistically sound way to draw conclusions from your data.
Its wide applicability in fields like medicine, education, business, and social sciences makes it a must-have in every researcher’s toolbox. However, like any statistical test, it must be used correctly and interpreted in the context of the research question and data quality.
Always remember: it doesn’t just crunch numbers—it helps reveal meaningful patterns hidden in data!
FREQUENTLY ASKED QUESTION
What is a Chi-square test used for?
The Chi-square test is used to determine whether there is a significant association between categorical variables or whether observed data fits an expected distribution.
What are the types of Chi-square tests?
There are two main types:
Chi-square Test of Independence: Tests relationships between two categorical variables.
Chi-square Goodness-of-Fit Test: Tests how well an observed distribution matches an expected distribution.
What kind of data is required for a Chi-square test?
You need categorical data represented in counts or frequencies (not percentages or averages). Each data point should fall into only one category.
Related Articles