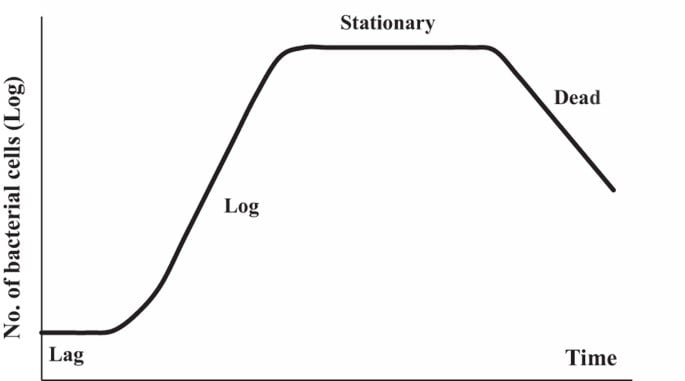
Understanding the growth patterns of bacterial populations is critical for microbiology, biotechnology, and a variety of industrial applications. The bacterial growth curve protocol, which illustrates variations in the quantity of bacteria over time, gives important information about bacterial behavior under various environmental conditions. The growth curve allows researchers to improve culture conditions, evaluate antibiotic effects, and investigate bacterial physiology by tracking critical phases such as lag, log (exponential), stationary, and death. This technique illustrates how to measure and plot a bacterial growth curve, allowing for exact analysis and use in both research and practical situations.
Table of Contents
Principle of Bacterial Growth Curve Protocol
Lag phase
- Bacteria adapt to new environments.
- High metabolic activity and minimal cell division.
Log (Exponential) Phase
- Rapid cell division and population growth.
- Consistent doubling time and a sharp increase in OD600.
Stationary phase
- Nutrient depletion and waste buildup.
- Growth rate equals death rate, resulting in steady OD600.
Death phase
- Viable cell count declines due to nutritional constraints and waste.
- A decrease in OD600.

Materials Required for Bacterial Growth Curve Protocol
- Bacterial culture (fresh, stationary phase is optimal)
- Sterile broth medium (suitable for your bacteria).
- Erlenmeyer Flasks
- Spectrophotometer with cuvettes (alternative cell counting method)
- Set the incubator to the ideal growing temperature for your bacteria.
- Pipettes
- Sterile test tubes
Procedure for Bacterial Growth Curve Protocol
Prepare the culture
- If using a fresh culture, dilute it properly in sterile broth to get a starting concentration in the exponential growth phase (see references for your bacteria).
- If you’re using a stationary phase culture, revive it by transferring a tiny amount to fresh broth and incubation for a few hours until the early exponential phase is achieved.
Innoculate flasks
- Fill each Erlenmeyer flask with sterilized broth (volume varies depending on the experiment).
- Inoculate each flask with a known amount of the prepared culture.
- Prepare a control flask with only sterilized broth (for background subtraction).

Measure OD (optional)
- Set your spectrophotometer to the proper wavelength for cell density measurement (often 600 nm).
- Use the blank broth to zero the spectrophotometer.
- At the start (t=0), take a sample from each flask and measure its optical density (OD). Discard this sample.
Incubation
- Incubate all flasks at the appropriate temperature and aeration levels for your microorganisms.
Measure the OD or cell count
- Withdraw a sample from each flask regularly (e.g., every 30 minutes to 1 hour) and measure its OD, or use an alternate method to count cells.
- Following measurement, discard the used sample.
- Ensure that measurements are taken within the linear range of the chosen method (OD or CFU).
Data Analysis
- Plot the OD or cell count measurements against the incubation time for each culture.
- The growth curve typically shows four phases:
- Lag phase: Slow initial development as bacteria adjust to their new habitat.
- The exponential phase (log phase) refers to rapid exponential growth.
- Stationary phase: Growth stops due to nutrient depletion or waste accumulation.
- Death phase (decline phase): Cell death caused by nutritional deficiency or adverse circumstances.
Tips – Bacterial Growth Curve Protocol
- Work aseptically to prevent contamination.
- Maintain a consistent sample volume throughout the experiment.
- To improve accuracy, repeat the experiment several times.
- The particular growth rate can be calculated using the data from the exponential phase.
Additional considerations – Bacterial Growth Curve Protocol
- This methodology is a general guideline that may need to be adjusted depending on the bacteria and measures required.
- Depending on the objectives of the experiment, alternative methods for cell number measurement can be used in addition to OD or CFU counts.
- Consult relevant scientific references for more information on growing your specific bacteria and growth curve analysis.
In conclusion, the bacterial growth curve protocol is a fundamental microbiology technique that allows for extensive research of bacterial population dynamics under controlled settings. By measuring and graphing the optical density at 600 nm (OD600) over time, researchers can discern the lag, log, stationary, and death stages of bacterial development. This approach gives important information about bacterial physiology, growth rates, and the effects of various environmental factors and therapies. Understanding these growth properties is critical for optimizing bacterial cultures in research, biotechnology, and industrial applications, thereby improving our understanding and use of bacterial systems.
Frequently Asked Questions (FAQ)
What is a bacterial growth curve?
A bacterial growth curve is a graphical representation of a bacterial population’s growth over time, including four phases: lag, log (exponential), stationary, and death.
Why is the lag phase important?
The lag phase occurs when bacteria adapt to new environmental conditions by producing essential enzymes and molecules before beginning to divide rapidly.
What insights can be gained from a bacterial growth curve?
Information about growth rates, doubling time, the length of each development phase, and the general health and viability of the bacterial culture can be gained from a bacterial growth curve.
Related Articles

