
ANOVA is founded on the notion of splitting total variance in data into components that can be assigned to different sources. These sources often include variation between groups, within groups, and, in certain cases, interaction effects between variables. It analyzes if the differences between group means are statistically significant or may have happened by chance by evaluating various sources of variance.
Table of Contents
Definition of ANOVA
Analysis of Variance (ANOVA) is a statistical method for analyzing the variations between group averages in a sample. It contributes to determining whether there are statistically significant differences between the means of three or more groups. It determines if the means of distinct groups are the same or if there are differences due to some independent variable(s).
Types and Aspects
One-Way ANOVA
It is utilized when there is only one independent variable or factor with two or more levels or groups. For example, assume we want to compare the impact of three different teaching approaches on student test scores. We would have one independent variable (teaching technique) and three levels (methods A, B, and C). It compares the null hypothesis (that all group means are equal) to the alternative hypothesis (that at least one group mean differs from the others). The F-statistic is used in this aspect to examine the variance between group means and the variation within groups.
Two-Way ANOVA
It expands the analysis to include two independent variables or factors, assessing both the main effects and the interaction effects between them. For example, in a study looking at the impact of gender and age on exam scores, gender and age would be the two independent variables. It allows us to establish whether each independent variable has a main effect and whether the effects of one variable are affected by the levels of the other variable (interaction effect).
ANOVA Table
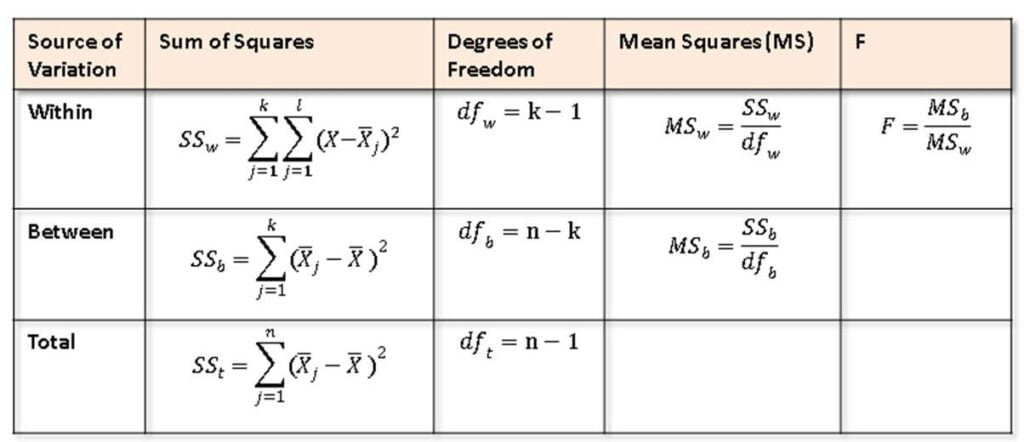
ANOVA table summarizes the sources of variation, degrees of freedom, sums of squares, mean squares, F-statistic, and p-value. It gives information about the significance of the factors under consideration and aids in the interpretation of the analysis’ results. The table summarizes data variation and evaluates the significance of mean differences across groups. It contains the following:
Source of Variation: Between Groups (group differences) and Within Groups (individual differences).
Degrees of freedom (DF): Indicates the number of independent information sources.
Sum of Squares (SS): Total variability in data, classified as Between Groups (SSB) and Within Groups (SSW).
Mean Squares (MS): SS divided by DF, which represents average variability.
F-statistic: It is a ratio of variation between group means to variance within groups.
P-value: It indicates the chance of detecting the obtained F-value under the null hypothesis.
The table aids in determining if observed variations between group averages are statistically significant, allowing for more accurate inferences about the impact of independent variables on the dependent variable.
Uses of ANOVA
- In medicine, it is used to assess the efficacy of several treatments for a specific disease or condition.
- In education, it can be used to assess the effect of various teaching approaches or interventions on student learning outcomes.
- In psychology, it can be used to investigate how experimental manipulations or treatments affect behavioral responses.
- In economics, it can be used to measure the impact of many factors on economic outcomes such as income or customer behavior.
- In biology, it is used to compare the impact of various treatments or circumstances on biological systems such as plant growth or animal behavior.
To summarize, ANOVA is a versatile and commonly used statistical method for comparing means across groups or situations. It gives useful information about the effects of independent variables on a dependent variable and is relevant to a wide range of research issues and study types. However, it is critical to ensure that its assumptions are met and that the results are carefully interpreted, taking into account the study’s context and the specific research issues under consideration.
Frequently Asked Questions (FAQ)
What is an ANOVA?
ANOVA stands for Analysis of Variance. It is a statistical approach for comparing the means of three or more groups to see if they differ significantly.
What does the ANOVA table indicate?
The ANOVA table highlights the sources of variation, both across and within groups, as well as their degrees of freedom, sums of squares, mean squares, F-statistic, and p-value.
What assumptions should I examine before running an ANOVA?
Common assumptions include data normality, variance homogeneity, and observation independence.
Related Articles